Getting Started with Zoho Analytics: Setup, Data Import & Your First Report
If you are ready to move beyond spreadsheets, this Zoho Analytics tutorial is your starting point. Zoho Analytics is a cloud-based business intelligence platform that connects to your data sources — CRM records, accounting exports, CSV uploads — and turns them into live, queryable reports. No more Monday morning ritual of pulling exports and stitching pivot tables together. Reports update automatically and insights are always one click away.
This is Part 1 of a three-part Zoho Analytics tutorial series. By the end of this post you will have a live account, a dataset imported from CSV, and a working bar chart report — all built in under 30 minutes. Part 2 covers building dashboards and shared views. Part 3 covers the native Zoho CRM connector.
Table of Contents
What You Are Building in This Zoho Analytics Tutorial
Here is exactly what this post covers, step by step:
- A Zoho Analytics account and dedicated workspace
- A dataset loaded from a CSV file with five columns
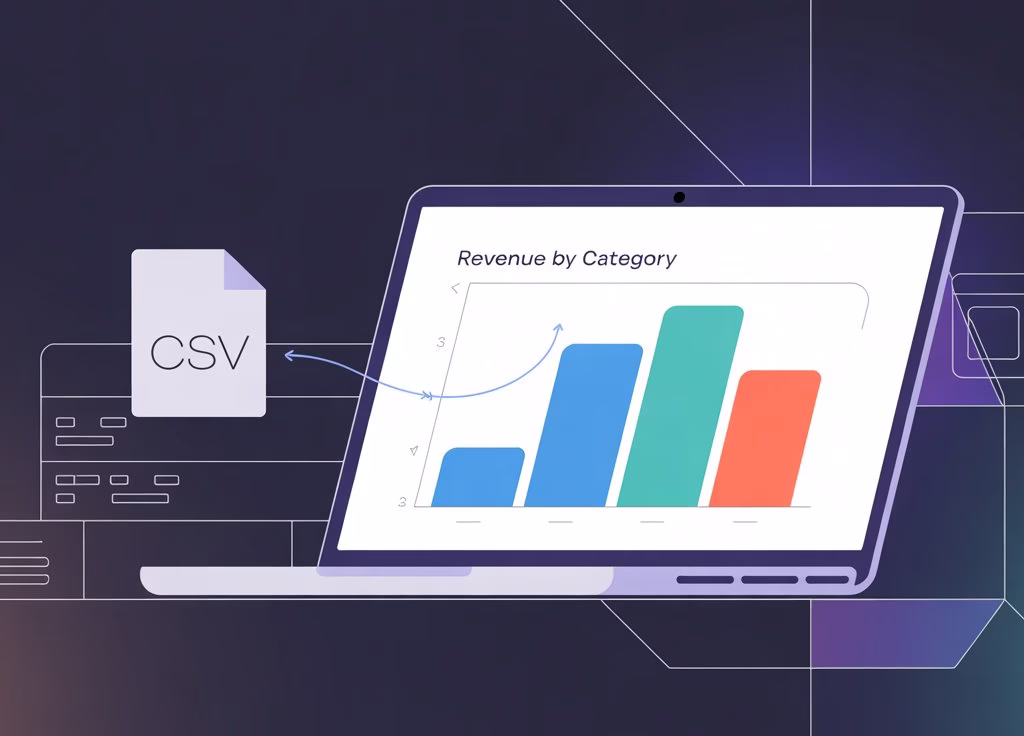
- A bar chart report showing total revenue by product category
- A live date filter applied without reloading the page
- A practical understanding of how Zoho Analytics structures workspaces, tables, and reports

Why Zoho Analytics Instead of a Spreadsheet?
Spreadsheets work well for small static datasets and one-off calculations. They break down when your data comes from multiple sources, updates frequently, or needs to be shared across a team with different access levels. Here is where Zoho Analytics closes that gap:
| Scenario | Spreadsheet | Zoho Analytics |
|---|---|---|
| Data from one file | Fine | Fine |
| Data from 3+ sources | Manual merge required | Automated connectors |
| Weekly recurring report | Rebuild every week | Auto-refresh on schedule |
| Team sharing with permissions | File duplication | Built-in user roles |
| 1 million+ rows | Slow or crashes | Handles billions of rows |
Zoho Analytics has been in market since 2009 and integrates natively with the broader Zoho ecosystem. If your organization already uses Zoho CRM, the analytics connector pulls deal pipeline, lead conversion, and activity data directly — no exports needed. That integration is covered in full in Part 3 of this series.
Step 1 — Create Your Zoho Analytics Account and First Workspace
Navigate to analytics.zoho.com and sign up for a free plan. The free tier gives you two users, five workspaces, and up to 10,000 rows — enough to complete this entire Zoho Analytics tutorial series without spending anything.
Once inside the portal, click + New Workspace. Give it a purposeful name — Sales Performance 2026 communicates scope far better than My Workspace. A workspace is the container for all your tables, reports, and dashboards. Think of it as a project folder that Zoho Analytics knows how to query.
Tip: If your organization already has a Zoho One or Zoho CRM subscription, sign in with the same account. Your Zoho Analytics workspace will inherit the same user directory, which makes sharing reports and managing permissions much simpler later.
Step 2 — Import Your First Dataset into Zoho Analytics
Zoho Analytics can pull data from local files, cloud databases, live URLs, and over 500 third-party app connectors. For this tutorial, start with a CSV — it removes all authentication variables and keeps the focus entirely on learning how Zoho Analytics works.
Use the sample sales CSV below, or substitute your own file with these five columns: Date, Product, Category, Revenue, and Units.
Date,Product,Category,Revenue,Units
2026-01-05,Wireless Headphones,Electronics,12400,62
2026-01-12,Office Chair,Furniture,8750,25
2026-01-18,Running Shoes,Apparel,4320,48
2026-02-03,Laptop Stand,Electronics,3150,45
2026-02-14,Desk Lamp,Furniture,1980,66
2026-02-22,Yoga Mat,Apparel,2100,70
2026-03-01,USB-C Hub,Electronics,5600,80
2026-03-10,Bookshelf,Furniture,6300,18
2026-03-25,Jacket,Apparel,9200,46
Inside your workspace, click Import Data → From File → Upload. Select your CSV. Zoho Analytics detects column types automatically. Before confirming the import, verify these assignments:
Date— set to Date typeRevenueandUnits— set to Number typeProductandCategory— set to Plain Text type
Column type mismatches are the most common reason aggregations fail in Zoho Analytics. A Revenue column typed as Plain Text returns zero when you try to sum it — silently, with no error message. Always confirm types before clicking Import.
Step 3 — Build Your First Zoho Analytics Report
With the table open in Zoho Analytics, click + New → Chart View. The chart builder opens with your table columns listed in the left panel.
Configure the chart with these settings:
| Field | Setting |
|---|---|
| Chart type | Bar |
| X-Axis | Category |
| Y-Axis | Revenue — aggregation set to Sum |
| Color | Auto |
Click Save and name the report Revenue by Category. Zoho Analytics renders the bar chart immediately — total revenue per category, aggregated across all dates in your dataset.
To make the report more actionable, add a date filter. Click Add Filter → Date → Date Range and set the range to the current quarter. The chart updates in real time without reloading the page — Zoho Analytics runs the aggregation live against your stored table each time a filter changes. This live querying behavior is one of the core advantages over static spreadsheet charts.
4 Common Pitfalls New Zoho Analytics Users Hit
These four issues account for the majority of broken reports and frustrated first-time Zoho Analytics users:
1. Column Type Mismatches
If Revenue imports as Plain Text, sum aggregations return zero with no error message. Re-import with the correct type, or use Data Type → Change from the Zoho Analytics table editor. Verify types immediately after every import before building reports.
2. Date Format Inconsistencies
Zoho Analytics expects ISO 8601 format (YYYY-MM-DD) by default. If your CSV uses MM/DD/YYYY or another format, specify it in the import dialog under Advanced Settings → Date Format. A single malformed date row can silently break all time-series charts — the chart renders but aggregates incorrectly.
3. Row Limits on the Free Plan
The Zoho Analytics free plan caps at 10,000 rows per workspace across all tables combined. If you are importing historical data, pre-aggregate it to weekly or monthly granularity before import. This is good data hygiene regardless of plan level — summarized data queries faster and dashboards render more responsively.
4. Browser Caching
If your Zoho Analytics report shows stale data after a re-import, hard-refresh the page (Ctrl+Shift+R on Windows, Cmd+Shift+R on Mac). Zoho Analytics caches report renders aggressively in the browser for speed, which can make fresh data look stale until you force a reload.
Zoho Analytics Pricing: Free vs Paid Plans
Zoho Analytics offers four pricing tiers. Understanding the limits before you start prevents having to migrate workspaces later.
| Plan | Users | Rows | Price (annual) |
|---|---|---|---|
| Free | 2 | 10,000 |
Frequently Asked Questions |
| Basic | 2 | 500,000 | /mo |
| Standard | 5 | 5 million | /mo |
| Premium | 15 | 50 million | 5/mo |
For most teams starting this Zoho Analytics tutorial series, the free plan is sufficient. When you outgrow 10,000 rows or need more than two users, the Basic plan is the natural upgrade. The Standard and Premium plans are designed for organizations that need to analyse millions of transactions or give analytics access to an entire department.
One important note: if you are already on a Zoho One subscription, Zoho Analytics is included at the Standard plan level. Check your Zoho One account before purchasing a standalone Zoho Analytics plan.
Frequently Asked Questions About Zoho Analytics
Is Zoho Analytics free?
Yes. Zoho Analytics has a permanent free plan that supports 2 users, 5 workspaces, and 10,000 rows of data. Paid plans start at $30 per month billed annually for 2 users, with higher row limits, more connectors, and advanced AI features. For most small teams following this Zoho Analytics tutorial series, the free plan is sufficient for several months of learning.
How is Zoho Analytics different from Zoho Reports?
Zoho Reports was the previous name for the same product. Zoho rebranded it to Zoho Analytics in 2018 to reflect expanded BI and AI capabilities. Older tutorials referencing Zoho Reports translate directly to the current Zoho Analytics interface.
Can Zoho Analytics connect directly to Zoho CRM?
Yes. Zoho Analytics has a native connector for Zoho CRM that syncs Leads, Contacts, Deals, and Activities on an automatic schedule — no manual exports needed. This is covered in detail in Part 3 of this series. If you have already followed our Zoho CRM implementation guide, the Part 3 connector setup will feel very familiar.
What Is Next in This Zoho Analytics Series
You now have a live Zoho Analytics report connected to structured data. That is the foundation every more advanced use-case builds on.
Part 2 — Building Dashboards: Takes the report you just created plus two additional charts and combines them into a multi-panel Zoho Analytics dashboard. You will add cross-report filters, configure a shared read-only view, and learn how to embed a dashboard in an external webpage.
Part 3 — CRM Integration: Covers the native Zoho CRM connector — automatic module sync, deal pipeline reports, and the prebuilt CRM Analytics template. If you are already running Zoho CRM, this is the fastest path to sales performance visibility with no manual data handling.
Part of the Zoho Analytics Tutorial Series — a practical guide for teams moving from spreadsheets to connected, automated business intelligence.
Share this content: